
Experiment 1. Comparison of husbandry practices – growing height and age
November/December 2011
We examined every single oyster individually on Wednesday 16th November 2011 (there were about 8000). We had started to lose our oysters – around 30-95% of stock at one of the sites.

A dead oyster with no flesh remaining
We decided to increase our sampling frequency and so we checked all our oysters again after five days (21th November) and then after another three days (24th November) and six days (30th November). From this date we decided to sample oysters once a week (7th-14th-20th December) as the mortality rates appeared to be significantly lower (or nil at site B). We have graphed all the results so that you can easily see the mortality pattern at each site.
The initial findings showed that spat were much more sensitive to POMS virus than adults at both sites A and C as they died sooner. Regardless of age, growing oysters at a high height, or so that they spent less time in the water, delayed the disease. Adults at high height showed a good survival pattern for at least ten days into the outbreak.
While adult oysters are slowly dying in trays at site A and site C, better survival is still obvious in trays at the high height in comparison with the low height. Interestingly, the adult survivors remaining on 24th November at “low height” in site C (n=36 in total) were all still alive on 30th November, suggesting that transmission or disease progression had stopped since our last inspection. We decided to not extensively sample this batch so as to leave a maximum number of oysters in the trays to determine how long these “survivors” can stay alive.
Amazingly site B is still free of any sign of disease. Site B is literally in between the two affected sites (see the map on the experimental design page). At the beginning of the experiment, we were thinking that it was “just a question of time” but as the days go by, site B seems to be “the place to be” for the oysters in the Georges River.
From the 30th November, very few dead oysters were found at each sampling time whatever the age, height or location (site A, B ,C) indicating that the POMS outbreak appears to be over for the moment. Similar results were found in experiment 2 with low mortalities in baskets and trays whatever the location.
We keep checking oysters once a week at every site in case of a new POMS outbreak over the summer. If it occurs again in the Georges River we hopefully will be able to determine whether the amazing survival at site B is just luck or whether we have the first evidence of an environmental/site difference affecting POMS expression.
January/February 2012
A second POMS outbreak was detected in Woolooware Bay on the 10th of February. Site B has been severely affected with 100% mortality in spat recorded at that time, and an average of 30% mortality in adult oysters.
Adult oysters remaining at site A and C constitute small pools (25-60 oysters per treatment) of survivors from the first outbreak in November 2011. No death have been recorded so far during this second outbreak.


A large movement of farmed Sydney Rock Oysters occurred out of Woolooware Bay in January, with a transfer of approximately 700 000 farmed SRO from site B to Quibray Bay. Consequently, we can speculate whether this translocation might have played a role in the infection of site B.
Additionally, mortality appeared in trays and floating baskets which were part of Experiment 2.
March/April 2012
Mortality has been really low for the remaining adult oysters (survivors from first and second outbreaks: 60-70 per site) at sites A, B and C – Only one or two oysters found dead now and then. However, the story seems to be different for the wild population… In February we have observed a heavy settlement of wild spat on the lids of our trays (low height only) at all sites. Interestingly enough these wild spat were mostly dead or dying (90%) at sites A and C by the end of the March suggesting that POMS virus was still active in these parts of the River.
Also, the last check performed on the 02/04/2012 revealed dead oysters (mostly spat) in trays which are part of Experiment 2.
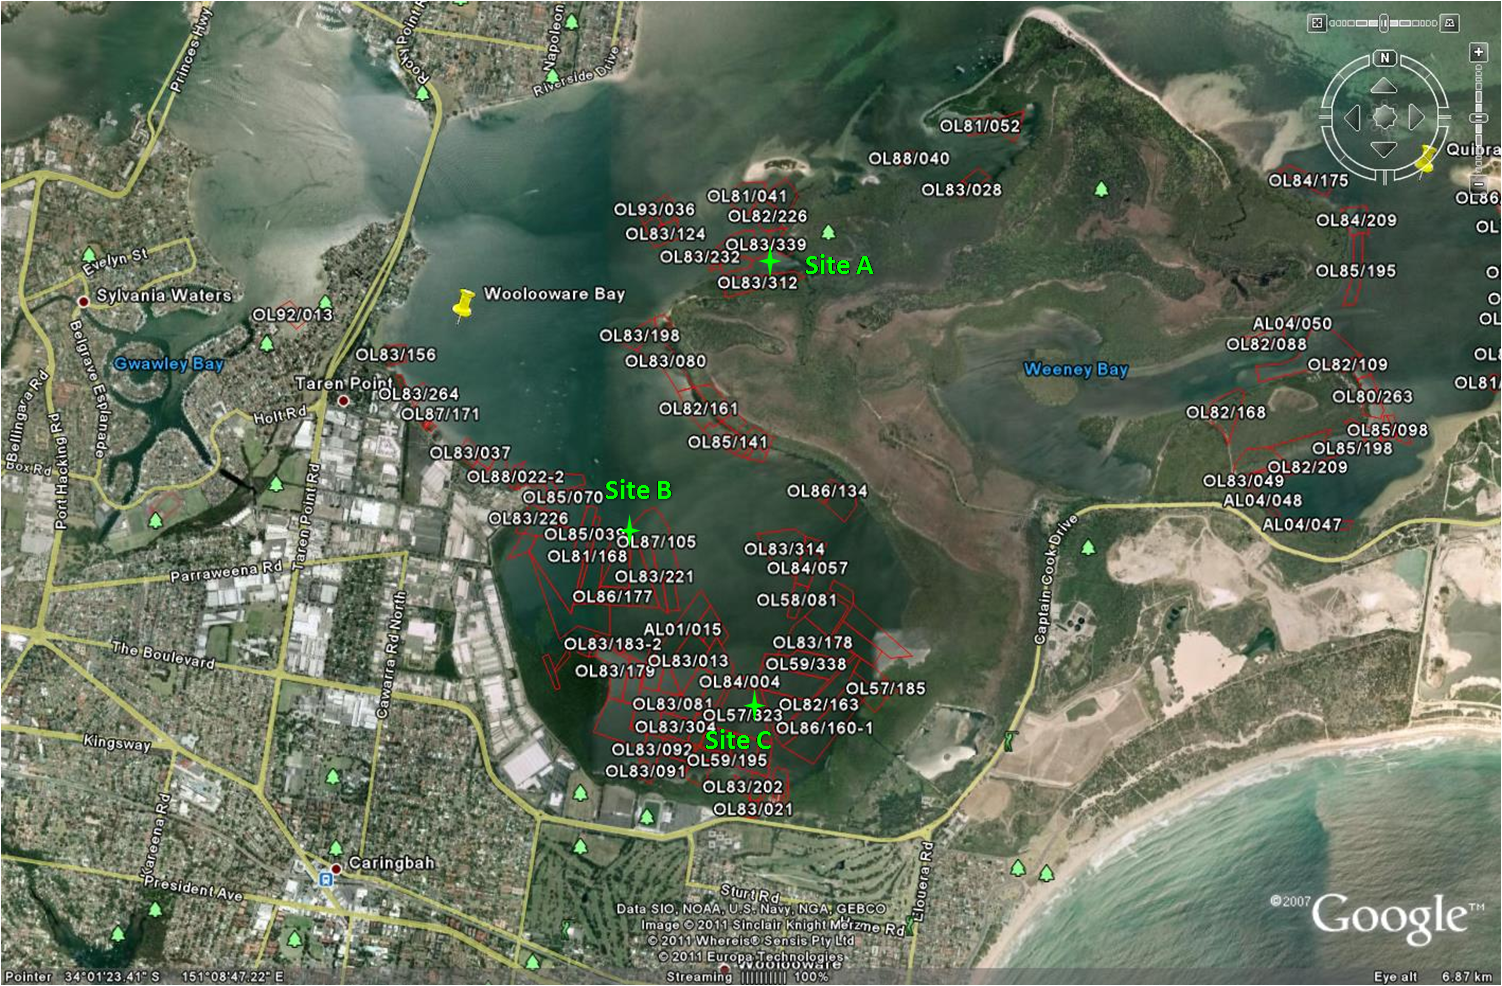
Sites A, B and C in Woolooware Bay

G’day Folks
Are the ‘high’ and ‘low’ sites across all sites at the same level of aerial exposure?
Do you have any indication of the hydrology of the bay, very odd results with B at the start.
Regards
Ian Duthie
Ian, the high and low racks were set up the same way at each of the three sites. The bay is fairly shallow, <3m throughout, with the odd sand bar and channel. We have not been able to find anything special about the hydrology of site B. RW