The virus OsHV-1 and the disease it causes, POMS, is currently confined to the NSW coast between the Hawkesbury River estuary and the Georges River estuary at Botany Bay. In Europe it is well established that the disease is triggered when water temperatures increase above 16 degrees C each spring-summer. We are currently analysing data from NSW for the period 2010-2015 to determine the water temperature patterns associated with seasonal POMS outbreaks. We are doing this so that we can try to predict the seasonal risk for POMS for other geographic areas in Australia.
We believe that temperature patterns for POMS in Australia differ from those in Europe; onset of disease is delayed relative to a seasonal threshold of 16 degrees C. To obtain information about water temperatures at oyster growing locations, temperature data loggers have been deployed on oyster leases in estuaries in NSW, Tasmania and South Australia using a data logger exchange and mail-back service. The current locations of the data loggers are shown in the maps below.
The collection of data is now complete. Results are available for 33 months from September 2014 to June 2017, and can be examined by reference to the maps and tables below.
This project was made possible by enthusiastic support from oyster farmers and by funding commencing in July 2015 from Oysters Australia and the University of Sydney, through the Fisheries Research and Development Corporation.
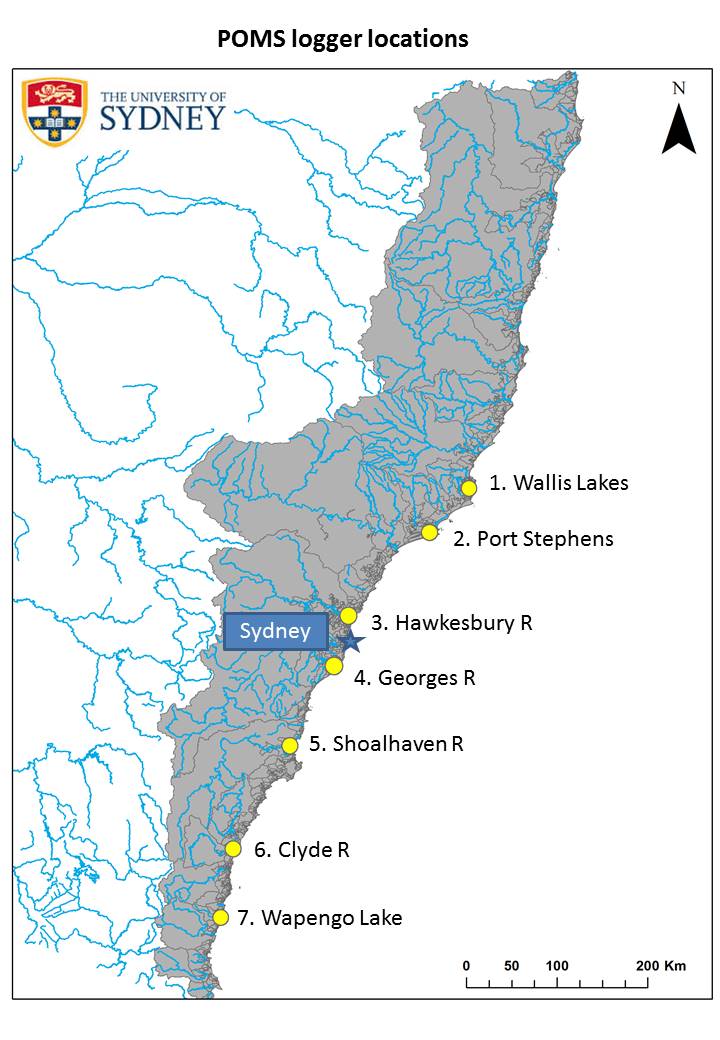
Locations of temperature data loggers on oyster leases in New South Wales
If you wish to view the NSW temperature data please click on the location in the table below:
| State | Location on map
Click on the number |
| NSW | 1 |
| NSW | 2 |
| NSW | 3 |
| NSW | 4 |
| NSW | 5 |
| NSW | 6 |
| NSW | 7 |
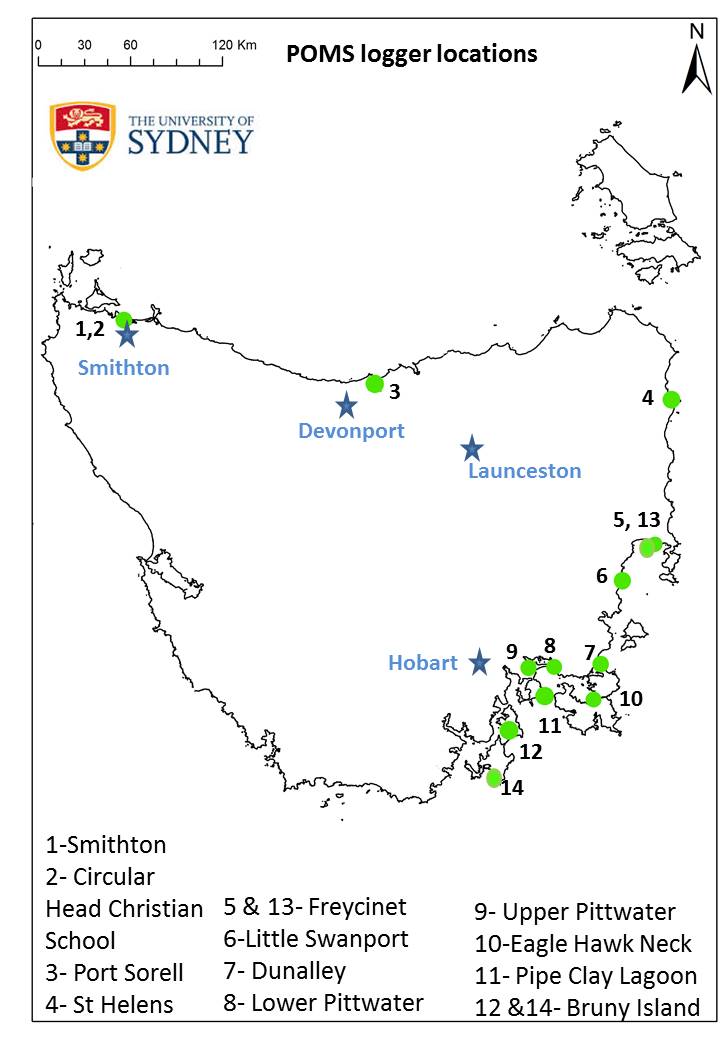
If you wish to view the TAS temperature data please click on the location in the table below:
| State | Location on map
Click on the number |
| TAS | 1 |
| TAS | 2 |
| TAS | 3 |
| TAS | 4 |
| TAS | 5 and 13 |
| TAS | 6 |
| TAS | 7 |
| TAS | 8 |
| TAS | 9 |
| TAS | 10 |
| TAS | 11 |
| TAS | 12 and 14 |
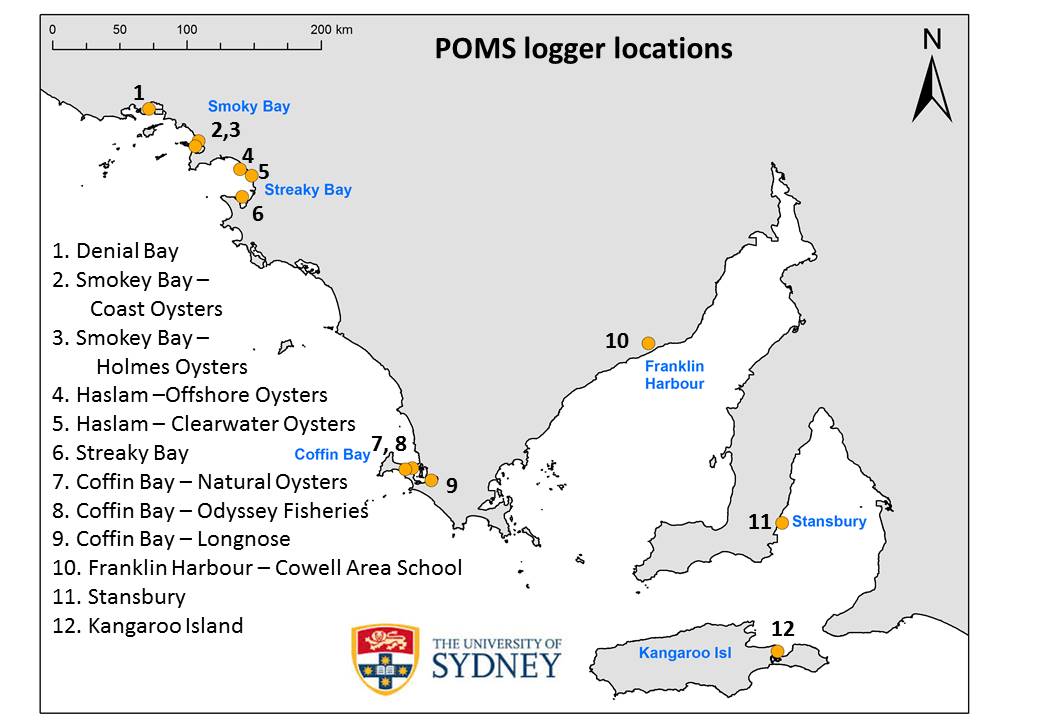
If you wish to view the SA temperature data please click on the location in the table below:
| State | Location on map
Click on the number |
| SA | 1 |
| SA | 2 |
| SA | 3 |
| SA | 4 |
| SA | 5 |
| SA | 6 |
| SA | 7 |
| SA | 8 |
| SA | 9 |
| SA | 10 |
| SA | 11 |
| SA | 12 |
